Sector-Specific Threat Reports for Vertical Marketing
Credible sector reports use deep data and methodology, not generic statistics.

The threat intelligence market is on track to roughly double, from $11.55 billion in 2025 to $22.97 billion by 2030 (a 14.7% compound annual growth rate). That's the backdrop for why every cybersecurity vendor and their cousin now publishes an "annual threat report." Most of them are the same twelve statistics wearing a different cover page.
What makes a sector threat report credible versus a rebadged vendor brochure
According to Bitsight, only 17% of companies can map threats and put multiple risk factors into real-time context. That's not a knock on security teams; it is a math problem, since the data is scattered, the adversaries move fast, and most "threat intelligence" arrives too generic to act on. A genuinely sector-specific report closes that gap. A rebadged one just adds to the pile.
Real sector intelligence comes from the vertical's own telemetry: its incident caseload, its regulatory pressure points, the specific ways adversaries target its infrastructure. Real sector intelligence comes from the vertical's own telemetry: its incident caseload, its regulatory pressure points, the specific ways adversaries target its infrastructure. A rebadged report takes cross-sector statistics, drops them into a document with a hospital or a factory on the cover, and calls it done. No mapping of threat actor tactics to sector-specific systems. No acknowledgment that a manufacturing attack surface looks nothing like a bank's.
Practitioners catch this instantly, and they don't forgive it. A SOC analyst working inside a hospital network reads a healthcare threat report the way a mechanic reads a repair manual, checking every claim against what's actually on the shop floor. A marketing director reads the same report as a vibe. Write for the vibe, and the analyst closes the tab in under a minute.
The actual threat reality by sector that a credible report must reflect
Healthcare took 445 ransomware attacks in 2025. Ninety-nine percent of hospitals are running devices with known, exploited vulnerabilities sitting on the network right now, not hypothetically. And once something goes wrong, it takes an average of 241 days to identify and contain the breach, which is long enough for an entire fiscal year to pass. The Trellix Advanced Research Center logged 54.7 million detections from healthcare customers alone in 2025. Mobile threats in the sector have surged sharply, among the highest increases of any industry measured.
Financial services plays a different game. BFSI commanded 20% of all threat intelligence market spend in 2025, more than any other vertical, pushed there by both a rising attack volume and compliance requirements that don't leave much room for guesswork.
Manufacturing has its own crown, and not the fun kind: Manufacturing has faced persistent targeting, with threat intelligence data pointing to it as a consistently high-priority sector for adversaries.
Three sectors, three completely different threat pictures. A report that flattens them into one generic narrative isn't wrong so much as useless.
How flagship threat reports use methodology to earn authority
Look at how the reports everyone actually trusts explain themselves. M-Trends 2026 built its findings on more than 500,000 hours of frontline incident investigations conducted globally in 2025. That's not a survey sample, that's operational scale, and it's stated up front because it's the whole argument for why the findings matter.
Flashpoint's 2026 GTIR takes a different route, using what it calls Primary Source Collection, pulling intelligence directly from closed forums, encrypted channels, and illicit marketplaces instead of secondhand feeds. Naming that method is itself part of the pitch. PwC's Annual Threat Dynamics 2026 pairs 2025 case studies with in-house analytics and makes a specific point that threat actor motivation shifts by sector, and the analytical lens matters as much as the raw data behind it.
None of these reports bury methodology in a footnote. They put it near the front, because methodology is the trust signal, not the disclaimer. A reader has to know where the intelligence came from before deciding how much weight to give the conclusions. Skipping that step makes even accurate findings read like guesswork.
Choosing the right vertical and the right threat angle before writing a single page
Not every vendor has earned the right to publish a healthcare report, or a manufacturing report, or any report at all in a vertical where the underlying data is thin. The choice has to follow the vendor's actual telemetry and case history, whatever the size of the total addressable market or which industry got the most headlines this year.
Healthcare is among the segments drawing significant investment growth in the threat intelligence market. Tempting, sure. But market growth doesn't hand a vendor healthcare-specific incident data it doesn't already have. Chasing the hot vertical without the caseload to back it up is how you end up writing exactly the rebadged brochure practitioners see through in one page.
Inside whatever vertical gets chosen, there's a second decision that matters just as much: which threat type does the data actually illuminate best? Ransomware, identity compromise, OT exposure, supply chain intrusion, pick one lane. A report that tries to cover every threat type in a sector usually ends up covering none of them with any depth.
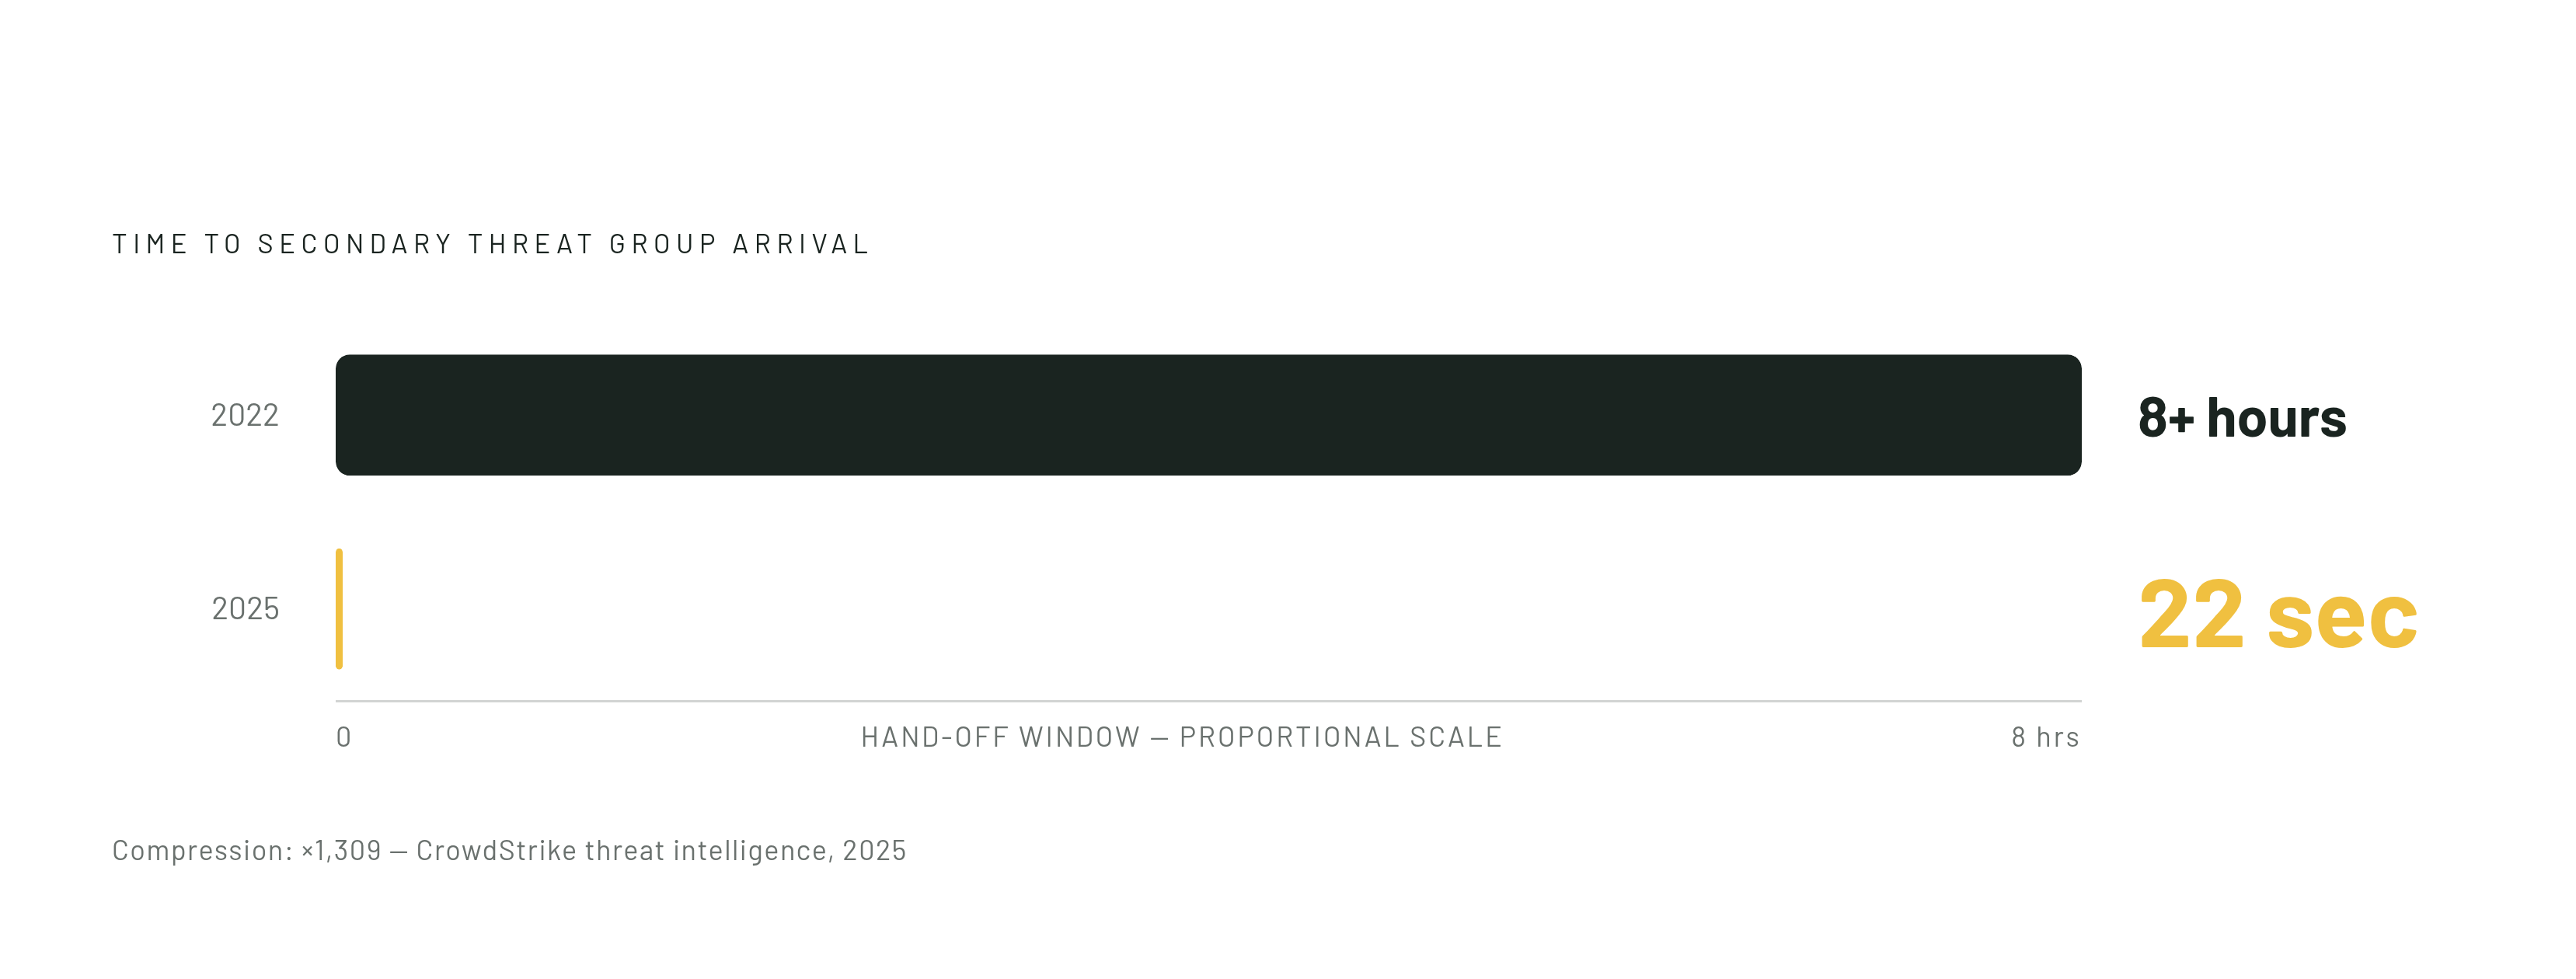
M-Trends 2026 makes this case with a single number. The hand-off window between initial access and the arrival of secondary threat groups collapsed from more than 8 hours in 2022 to just 22 seconds in 2025, a specific, operational insight that only shows up when the data is deep enough to catch it happening. The hand-off window between initial access and the arrival of secondary threat groups collapsed from more than 8 hours in 2022 to just 22 seconds in 2025, which is a specific, operational insight rather than a broad claim about "ransomware is bad."" That's a specific, operational insight visible only when the data is deep enough to catch it happening. A sector-specific report needs its own version of that number, something precise enough that a reader stops scrolling.
Structuring the report so it serves both the practitioner who reads it and the buyer who acts on it
Two different readers, two different jobs. The practitioner wants indicators, tactics, and technical detail that maps to what's happening in the actual environment. The buyer, whether that's a security executive, a security director, or a board liaison, wants the business-risk version: what does this threat mean for growth, market expansion, customer trust, regulatory exposure. Strategic intelligence has to speak both languages without insulting either one.
Resilience and recovery assurance, whether response plans actually hold up under a real attack rather than looking good on a slide, remain central concerns for security-conscious leadership. A report that wants to convert readers into pipeline needs to speak to that concern directly, not with generic vendor positioning bolted onto the end.
The structure that works follows a simple order. Open with the threat reality the practitioner immediately recognizes as accurate, because that's what earns the right to keep reading. Then build out the business risk implications the buyer needs in order to act. Close with the so-what, positioning the vendor's capability as one implication among several, not as the reason the whole report exists.
That last part is where most vendor reports go sideways. The product shows up as a conclusion the data was built to support, rather than something that simply follows from the intelligence. Readers spot a reverse-engineered report the same way they spot a rebadged one: fast, and without much patience for round two.
Deploying the report as a vertical marketing engine across the full funnel
The report itself is the anchor. Everything else is a derivative built off the same research: sector-specific blog posts, practitioner briefings, webinars, executive summaries trimmed for board audiences, sales enablement material. One research foundation, several formats, each one built for a different reader's attention span.
Flashpoint's 2026 GTIR pairs its report with a companion webinar where analysts walk through the key findings live. That single move reaches an entire audience of practitioners who will never download a PDF but will show up for forty-five minutes of an analyst explaining what the data actually means.
Distribution has to match the audience. Practitioners live in trade publications, security conferences, and vertical-specific ISAC and ISAO communities, places where credibility gets built through peer recognition. Buyers get reached through analyst relations, executive briefing programs, and gated content tied directly to a sales conversation.
On gating: split the difference. An ungated executive summary or key-findings document drives search visibility and awareness, no friction, anyone can read it. The full report sits behind a short registration form, light enough that it doesn't block practitioner access, but enough to capture intent signals for the sales team to work with later.
Measuring whether the report is working as a marketing asset
Download counts and social shares are the vanity metric trap. They measure distribution, not credibility. A report can rack up ten thousand downloads and generate zero sales conversations, and that report has not done its job, no matter how good the chart in slide four looks.
Look instead for practitioner trust signals: third-party security researchers or journalists citing the findings, references showing up in ISACs and forums and conference panels, requests for the vendor's own analysts to come present the research somewhere. That's the sign the intelligence got taken seriously by people who don't have to pretend to care.
Pipeline signals matter just as much. Watch for accounts that engaged with the report starting to show up in sales conversations, for shifts in deal velocity in that vertical during and after the report's launch window, and for inbound inquiries that name the report as the reason someone reached out.
And check whether the derivative content, the blog posts, the briefings, the webinar recordings, keeps generating engagement well past the launch week. A report that's forgotten in a month never had the depth to begin with. One that keeps getting cited, quoted, and referenced months later has done what a sector-specific report is supposed to do: earn trust from the people who read it closely enough to catch a fake.